Product analytics that reads like a data story.
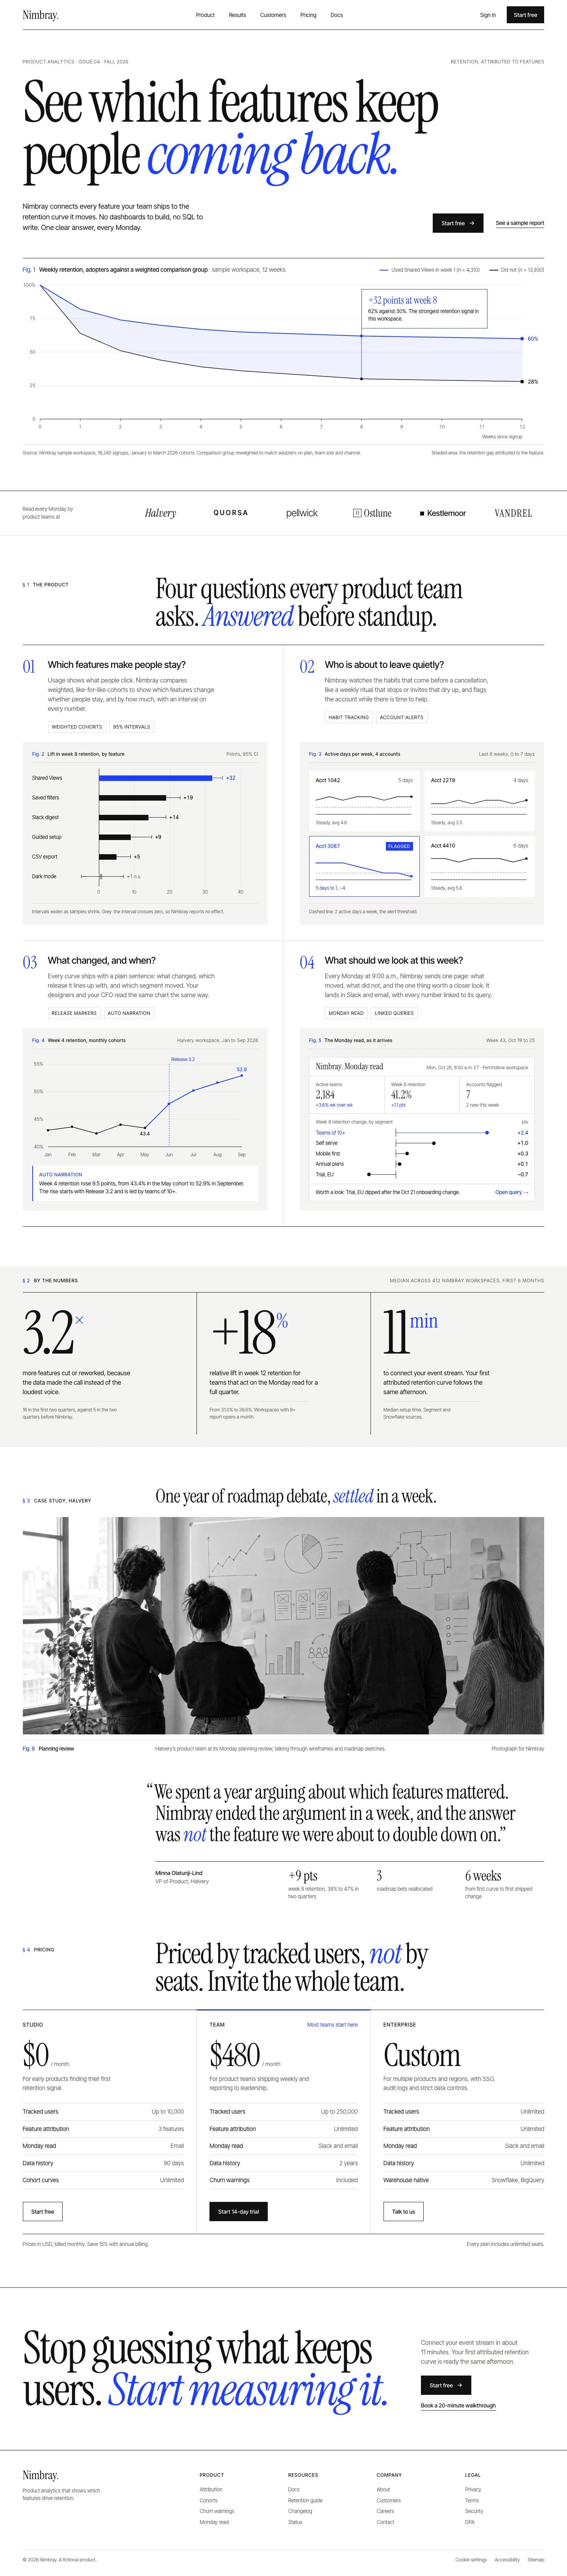
INSIDEA designed this homepage for a product analytics platform. Nimbray is a fictional brand, so the names, people and numbers on the page are invented.
- Industry
- Software and SaaS
- Typeface
- Instrument Serif
Analytics as a design magazine. Swiss grid, large serif headlines and data-journalism charts make retention data feel like a story worth reading.
The brief
Product teams have dashboards. What they lack is the answer to one question: which features keep people coming back.
The direction
A Swiss grid, a large serif and a single cobalt accent, with charts drawn in the style of data journalism rather than a dashboard.
The detail
Users who adopt Shared Views retain at 62% in week 8 against 30% for a weighted comparison group, and the 32-point gap is the same in the line chart, the bar chart and the copy.
- Display
- Instrument Serif
- Text
- Inter Tight
Want a site like this?
30 minutes with our team. We look at your current site and what a rebuild would take.
 How INSIDEA works