Marketing in 2026 has a weird tension running through it: the dollars keep climbing, but the tolerance for waste keeps shrinking.
In the U.S. alone, digital advertising revenue hit $259 billion in 2024, up 14.9% year over year, according to the IAB/PwC Internet Advertising Revenue Report. That growth didn’t come from one “hot” channel. It came from the mix that now carries most marketing programs: search, video, social, and retail media.
At the same time, marketing teams are being asked to do more with a smaller slice of company revenue. Gartner’s 2024 CMO Spend Survey put average marketing budgets at 7.7% of overall company revenue, down from 9.1% in 2023.
That gap is why benchmarks matter more than they used to. When budgets tighten, it’s harder to defend decisions based on taste, habit, or “we’ve always done it this way.”
Then there’s the AI layer. AI tools are advancing quickly, but public trust remains mixed. Pew Research found that U.S. adults and AI experts often see AI differently, and the report documents broad concern among Americans about how AI is developed and used.
If your marketing stack now includes AI in creative, targeting, customer support, or analytics, you’re operating in a market where performance and perception both affect results.
This blog compiles 110+ verified digital marketing statistics from credible sources, so you can benchmark performance and set targets you can defend.
Let’s get started!
SEO Statistics for 2026
1. Nearly 47% of All Website Visits Still Come From Organic Search
Organic search remains one of the dominant sources of traffic for websites, accounting for almost half of all visits. This highlights the continuing importance of SEO in driving meaningful, long-term web traffic and visibility.
Source: https://dndseoservices.com/blog/seo-statistics-benchmarks-2026/
2. The Top Organic Result on Google Captures ~27.2% of All Clicks
The importance of ranking in the top spot for relevant search queries is emphasized here. The first organic result consistently captures over a quarter of all clicks, reinforcing the value of optimizing for position one.
Source: https://seoprofy.com/blog/seo-statistics/
3. Google Holds Over 90% of the Global Search Market
Google continues to dominate the global search engine market, making it the most critical platform for SEO efforts. With such overwhelming dominance, prioritizing Google’s algorithm is key to any SEO strategy.
Source: https://seoprofy.com/blog/seo-statistics/
4. SEO Delivers up to 700% ROI When Done Well
One of SEO’s greatest strengths is its ability to generate a high return on investment. With the right strategies, businesses can achieve up to 700% ROI from their SEO efforts, demonstrating just how cost-effective and impactful SEO can be.
Source: https://seoprofy.com/blog/seo-statistics/
5. Over 56% of Companies Are Actively Using AI in Digital Marketing
AI tools have moved beyond experimental to mainstream in digital marketing. Over half of companies have integrated AI into their SEO and digital strategies, using it to automate content creation, optimize search rankings, and enhance customer experiences.
Source: https://www.webfx.com/blog/ai/ai-statistics/
6. Mobile Accounts for More Than 62% of Global Web Traffic
As mobile usage continues to rise, it now accounts for a majority of global web traffic. This highlights the crucial importance of mobile-first SEO strategies that ensure your website is optimized for smaller screens and faster load times.
Source: https://www.demandsage.com/seo-statistics/
7. Around 70% of Marketers Use Content Marketing as the Main Acquisition Channel
Content marketing remains a core acquisition strategy for marketers, with SEO as a natural extension. With more than 70% of marketers leveraging content to attract new customers, creating high-quality, optimized content is more important than ever.
Source: https://www.demandsage.com/seo-statistics/
8. 72% of Consumers Use Search Engines to Find Local Businesses
Local SEO has grown in importance as more than 70% of consumers use search engines to find businesses near them. Optimizing your site for local search, especially with tools like Google My Business, is crucial for appearing in local search results.
Source: https://www.seoprofy.com/blog/seo-statistics/
9. SEO Attracts More than 1,000% More Traffic Than Organic Social Media
Compared with organic social media efforts, SEO generates significantly more traffic. With SEO generating over 10 times the visits that organic social does, it’s clear why SEO should be prioritized in digital marketing strategies.
Source: https://www.seoprofy.com/blog/seo-statistics/
10. 49% of Marketers Say Organic Search Provides the Best ROI Across Marketing Channels
Organic search remains the highest-performing channel for ROI, according to nearly half of marketers. This reinforces the argument that SEO investments, while long-term, are crucial for sustained success.
Source: https://www.demandsage.com/seo-statistics/
11. 40% of Users Will Leave a Website if It Takes More Than 3 Seconds to Load
Page load time is a critical factor for user engagement and SEO. With nearly 40% of users abandoning websites that take too long to load, improving site speed is a key focus area for SEO optimization.
Source: https://www.webfx.com/blog/ai/ai-statistics/
12. Over 86% of SEO Professionals Included AI in Their SEO Strategy
AI is now a staple in SEO strategies, with more than 85% of professionals integrating AI into their workflows. From content creation to data analysis, AI enhances SEO by streamlining processes and improving targeting accuracy.
Source: https://www.webfx.com/blog/ai/ai-statistics/
13. Organic Search Still Accounts for Over 53% of All Website Traffic
More than half of all trackable website traffic now comes from organic search, showing that despite AI and new channels, SEO remains the foundation for discovery and engagement on the web.
Source: https://www.wordstream.com/blog/seo-statistics
14. Google Receives About 99,000 Search Queries Per Second
This staggering volume of queries illustrates how central search remains to user behavior globally, billions of intentions expressed every day, making SEO relevant across industries and audiences.
Source: https://seo.ai/blog/how-many-people-use-google
15. 68% of Online Experiences Still Begin With a Search Engine
Search remains the first interaction point for most digital journeys, from product discovery to information gathering, which reinforces why ranking visibility is critical.
Source: https://sqmagazine.co.uk/google-seo-statistics/
16. Voice Search Accounts for ~21.7% of Google Queries
Voice‑enabled searches are no longer fringe behavior; over a fifth of queries now originate from voice devices, which has implications for conversational keywords and structured content.
Source: https://sqmagazine.co.uk/google-seo-statistics/
17. First Page Google Results Capture 54% of All Clicks
More than half of search clicks go to the first page of results, reinforcing the importance of ranking on page one, not just presence in search.
Source: https://www.explodingtopics.com/blog/seo-statistics
18. Nearly 60% of Searches Produce Zero Clicks to Websites
As AI Overviews and featured snippets grow, many searches now satisfy intent without leading to external clicks, a shift that changes how SEO success is measured.
Source: https://affinco.com/seo-statistics/
19. 64% of All Global Search Queries are Conducted on Mobile Devices
Mobile users now dominate search behavior, which means mobile‑first indexing and optimization aren’t optional; they’re baseline requirements for ranking performance.
Source: https://affinco.com/seo-statistics/
20. Google Will Process Nearly 7 Trillion Searches in 2026
Search volume globally continues to climb, with projections indicating almost 7 trillion queries will be processed in 2026, evidence of the scale and longevity of search demand.
Source: https://affinco.com/seo-statistics/
PPC Statistics for 2026
21. Average Search Ad Click‑Through Rate (CTR) Is Around 6.66%
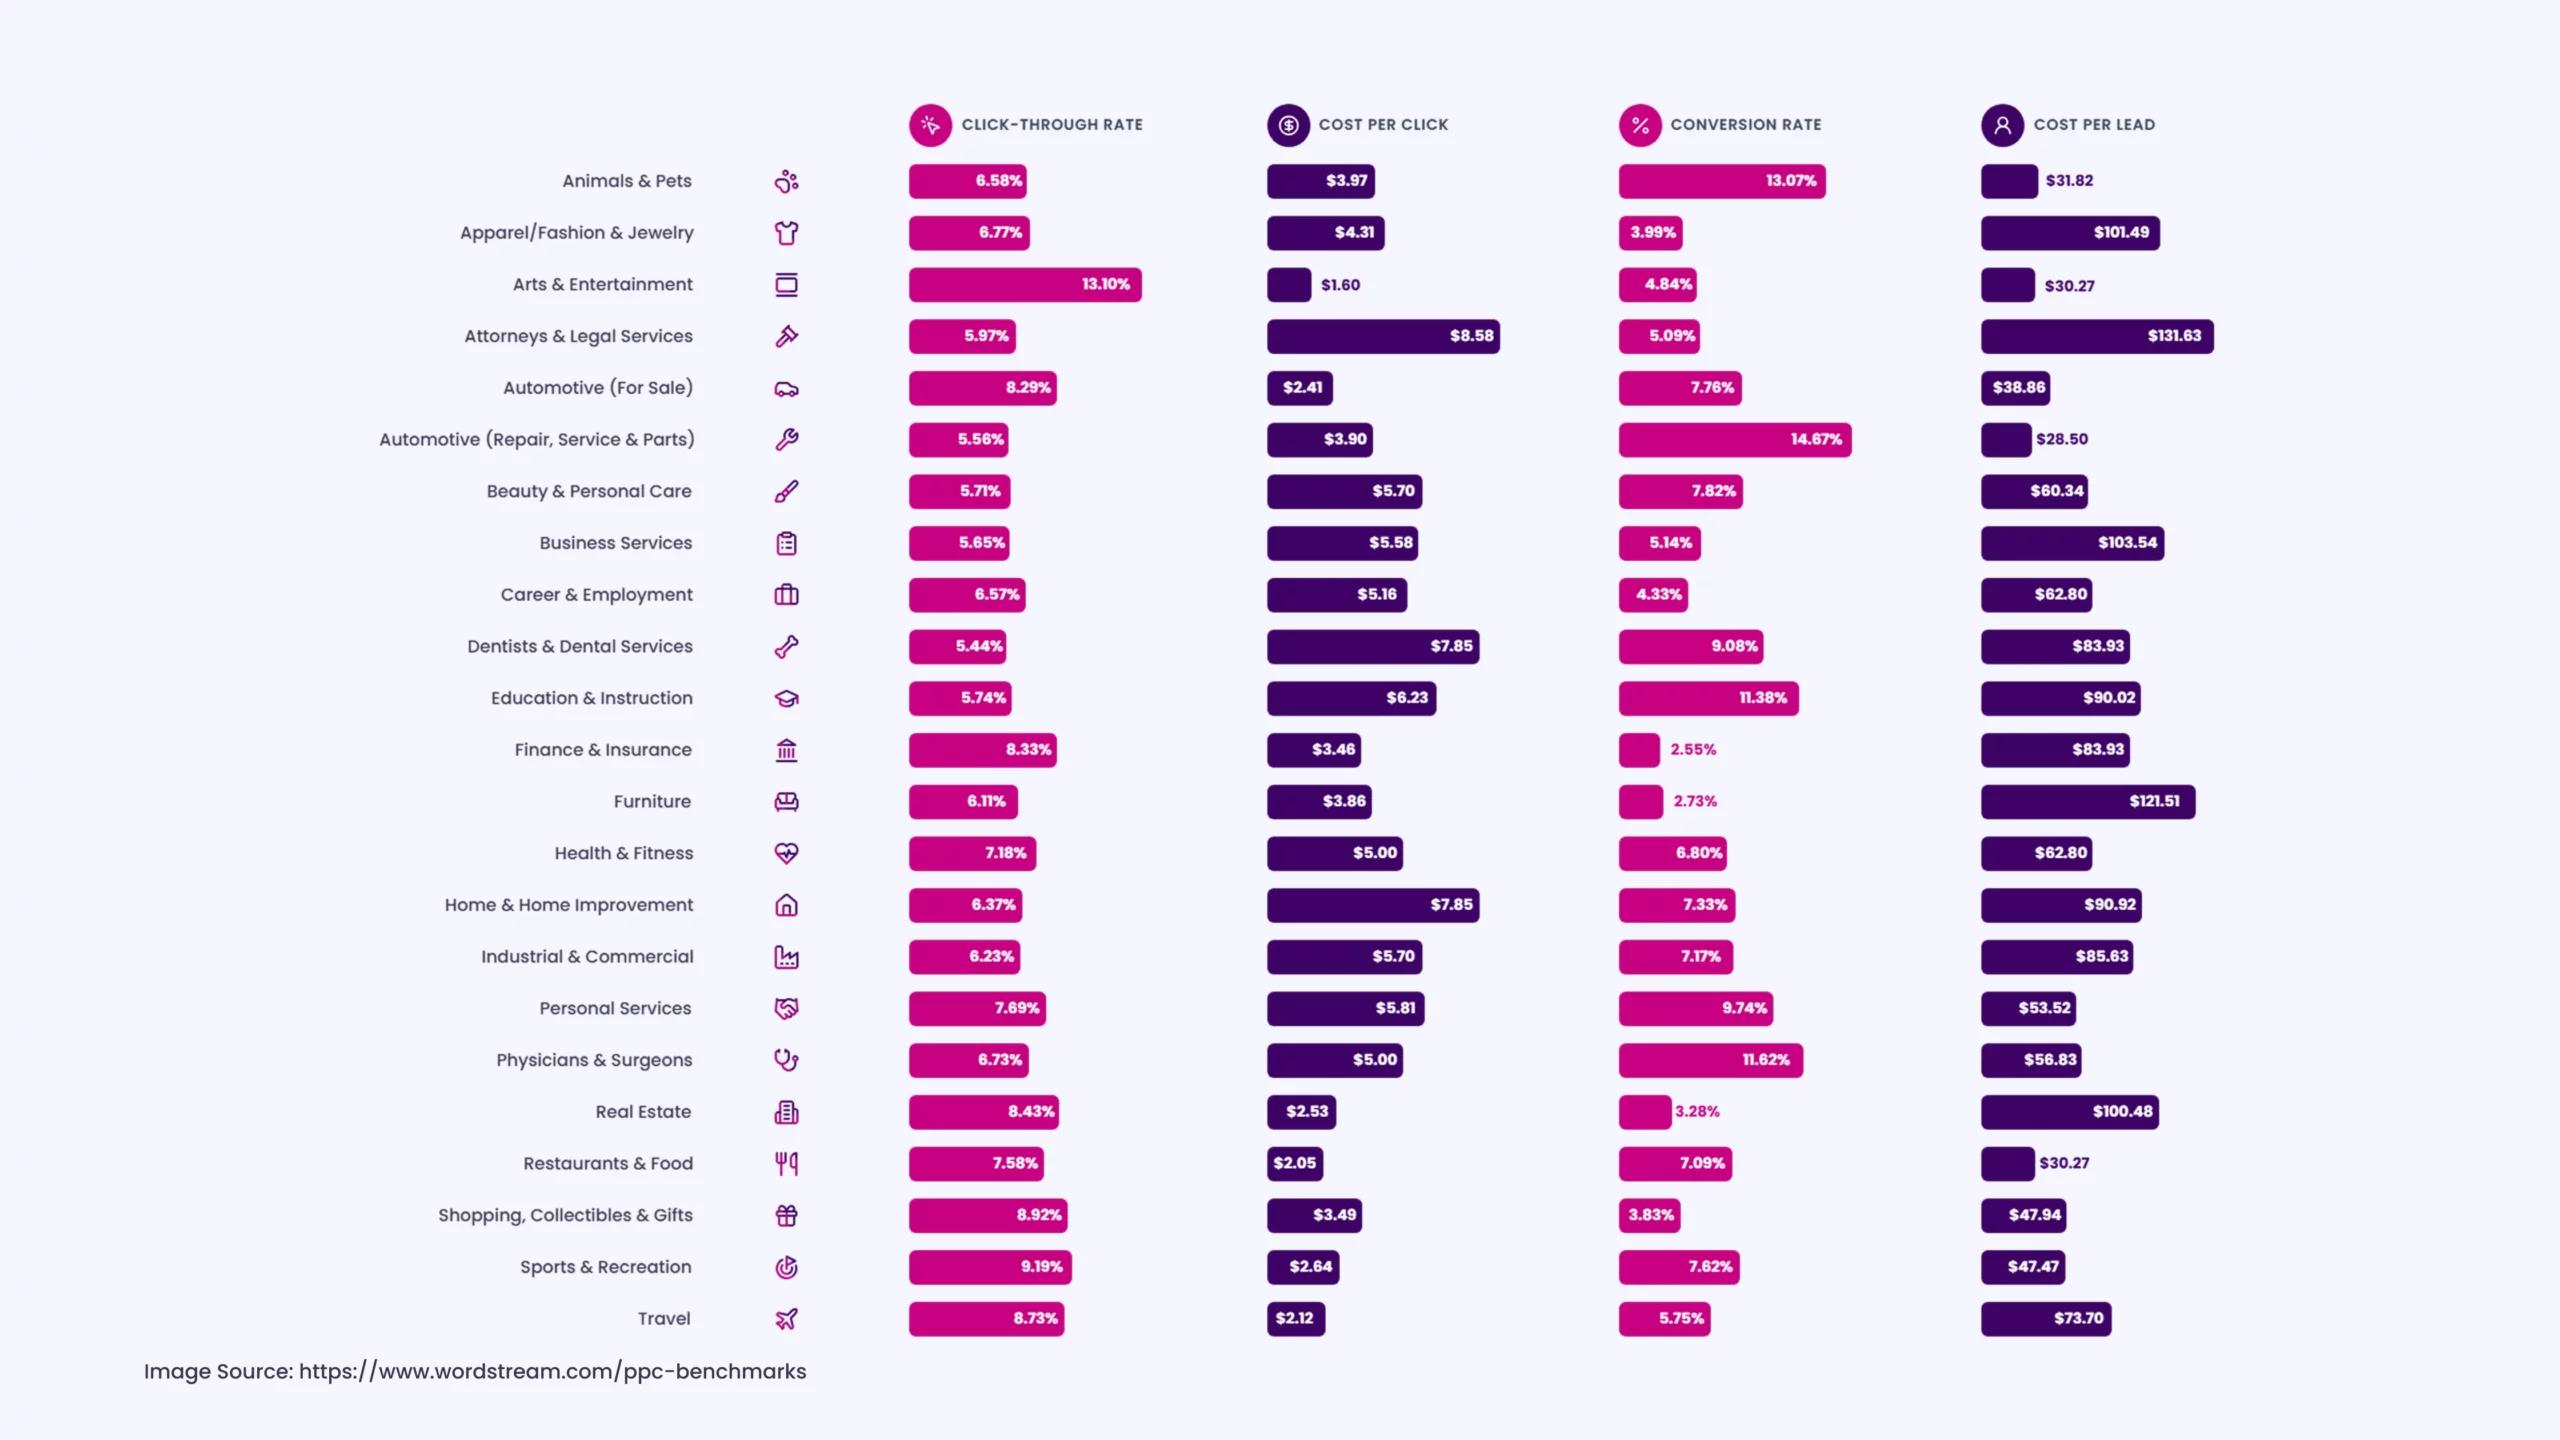
Image Source: https://www.wordstream.com/ppc-benchmarks
Across industries, paid search ads now average a 6.66% CTR, demonstrating how well they can attract clicks when aligned with user intent, a critical benchmark for campaign health.
Source: https://www.wordstream.com/ppc-benchmarks
22. Average Conversion Rate for PPC Ads Is ~7.52%
PPC campaigns are converting at roughly 7.52% on average, suggesting that if your campaigns fall below this, there’s room for optimization in ad messaging, landing pages, or bid strategies.
Source: https://www.wordstream.com/ppc-benchmarks
23. Average Cost Per Click (CPC) Across Search Ads Is About $5.26
Brands are paying a median of $5.26 per click for search ads, reflecting the competitive rates they face to secure visibility in paid search placements.
Source: https://www.wordstream.com/ppc-benchmarks
24. PPC Still Delivers a Strong ROI: ~$2 for Every $1 Spent
Businesses continue to see strong returns from PPC ads, with many earning an average of $2 in revenue for every $1 spent, underscoring paid search’s ongoing value when campaigns are finely tuned.
Source: https://marketingltb.com/blog/statistics/ppc-statistics/
25. PPC Accounts for ~41% of Digital Marketing Budgets
On average, nearly 41% of digital marketing budgets are allocated to PPC campaigns, underscoring the centrality of paid search in overall marketing spend allocation.
Source: https://marketingltb.com/blog/statistics/ppc-statistics/
26. 65% of Small‑to‑Medium Businesses Run PPC Campaigns
A majority of SMBs are actively using PPC, showing that paid search isn’t just for enterprise brands but a foundational tactic across company sizes.
Source: https://marketingltb.com/blog/statistics/ppc-statistics/
27. 78% of Marketers See PPC as a Major Growth Driver
Nearly 78% of marketers identify PPC as the primary driver of lead generation and growth goals, signaling confidence in paid search’s ability to drive measurable business outcomes.
Source: https://marketingltb.com/blog/statistics/ppc-statistics/
28. Paid Search Ads Increase Brand Awareness by ~33%
Beyond direct conversions, PPC also boosts brand visibility, on average by up to 33%, demonstrating how ads influence audience familiarity even without immediate clicks.
Source: https://www.webfx.com/blog/marketing/google-ads-statistics/
29. About 63% of People Have Clicked a Google Ad
User interaction with paid search remains high, with nearly two‑thirds of people reporting they’ve clicked on a Google ad, demonstrating that paid placements still command attention in search results.
Source: https://www.webfx.com/blog/marketing/google-ads-statistics/
30. PPC Visitors Are ~50% More Likely to Convert Than Organic Visitors
Traffic from paid campaigns tends to convert at a higher rate than organic search traffic, indicating that PPC not only drives volume but quality engagement when targeted correctly.
Source: https://www.webfx.com/blog/marketing/google-ads-statistics/
31. Google Shopping Ads Drive ~85% of Retail Search Ad Spend
Within search advertising, product‑focused Google Shopping Ads dominate retail spend and engagement, capturing a disproportionate share of retail PPC investment.
Source: https://www.webfx.com/blog/marketing/google-ads-statistics/
32. The Average Conversion Rate for Google Shopping Ads Is ~1.91%
While Shopping Ads may have a different intent profile than text search ads, they still deliver meaningful conversions, with an average conversion rate of roughly 1.91% across campaigns.
Source: https://www.webfx.com/blog/marketing/google-ads-statistics/
33. Google Ads Captures ~39.37% of the PPC Market
Google remains the dominant PPC platform, with nearly 40% of the total paid search market share, which explains why advertisers invest heavilyin its ad ecosystem.
Source: https://www.demandsage.com/google-ads-statistics/
34. Around 65% of SMBs use Google Ads for PPC Campaigns
Most small and mid‑sized businesses rely on Google Ads as their primary paid search channel, highlighting the platform’s broad adoption across diverse business types.
Source: https://www.demandsage.com/google-ads-statistics/
35. About 75% of PPC Professionals Use Generative AI for Ad Creation
A large share of PPC specialists now incorporate AI tools into campaign creation and optimization, showing how automation and smart tooling are becoming built‑in parts of paid search workflows.
Source: https://www.backlinko.com/ppc-statistics
Social Media & Influencer Marketing Statistics for 2026
36. Over 5.17 Billion People Worldwide Use Social Media
As of early 2025-2026 data, more than 5.17 billion people are active social media users globally, roughly two‑thirds of the world’s population, underscoring social media’s ubiquitous reach.
Source: https://sqmagazine.co.uk/social-media-marketing-statistics/
37. Social Media Platforms Reach More Than 64% of the World’s Population
Over 64% of the global population now uses at least one social platform, a figure that continues to climb as connectivity expands.
Source: https://newmedia.com/blog/social-media-marketing-statistics
38. Average Daily Time Spent on Social Media Is 2 Hours 29 Minutes
On average, social media users spend nearly 2 hours and 30 minutes daily scrolling, watching, and engaging, highlighting how entrenched these platforms are in everyday life.
Source: https://newmedia.com/blog/social-media-marketing-statistics
39. Short‑Form Video Accounts for More Than 60% of Social Consumption
Video, especially short‑form, dominates social media content, accounting for the majority of consumption across platforms like TikTok, Instagram Reels, and YouTube Shorts.
Source: https://sqmagazine.co.uk/social-media-marketing-statistics/
40. Marketers Focus on Up to Five Social Platforms
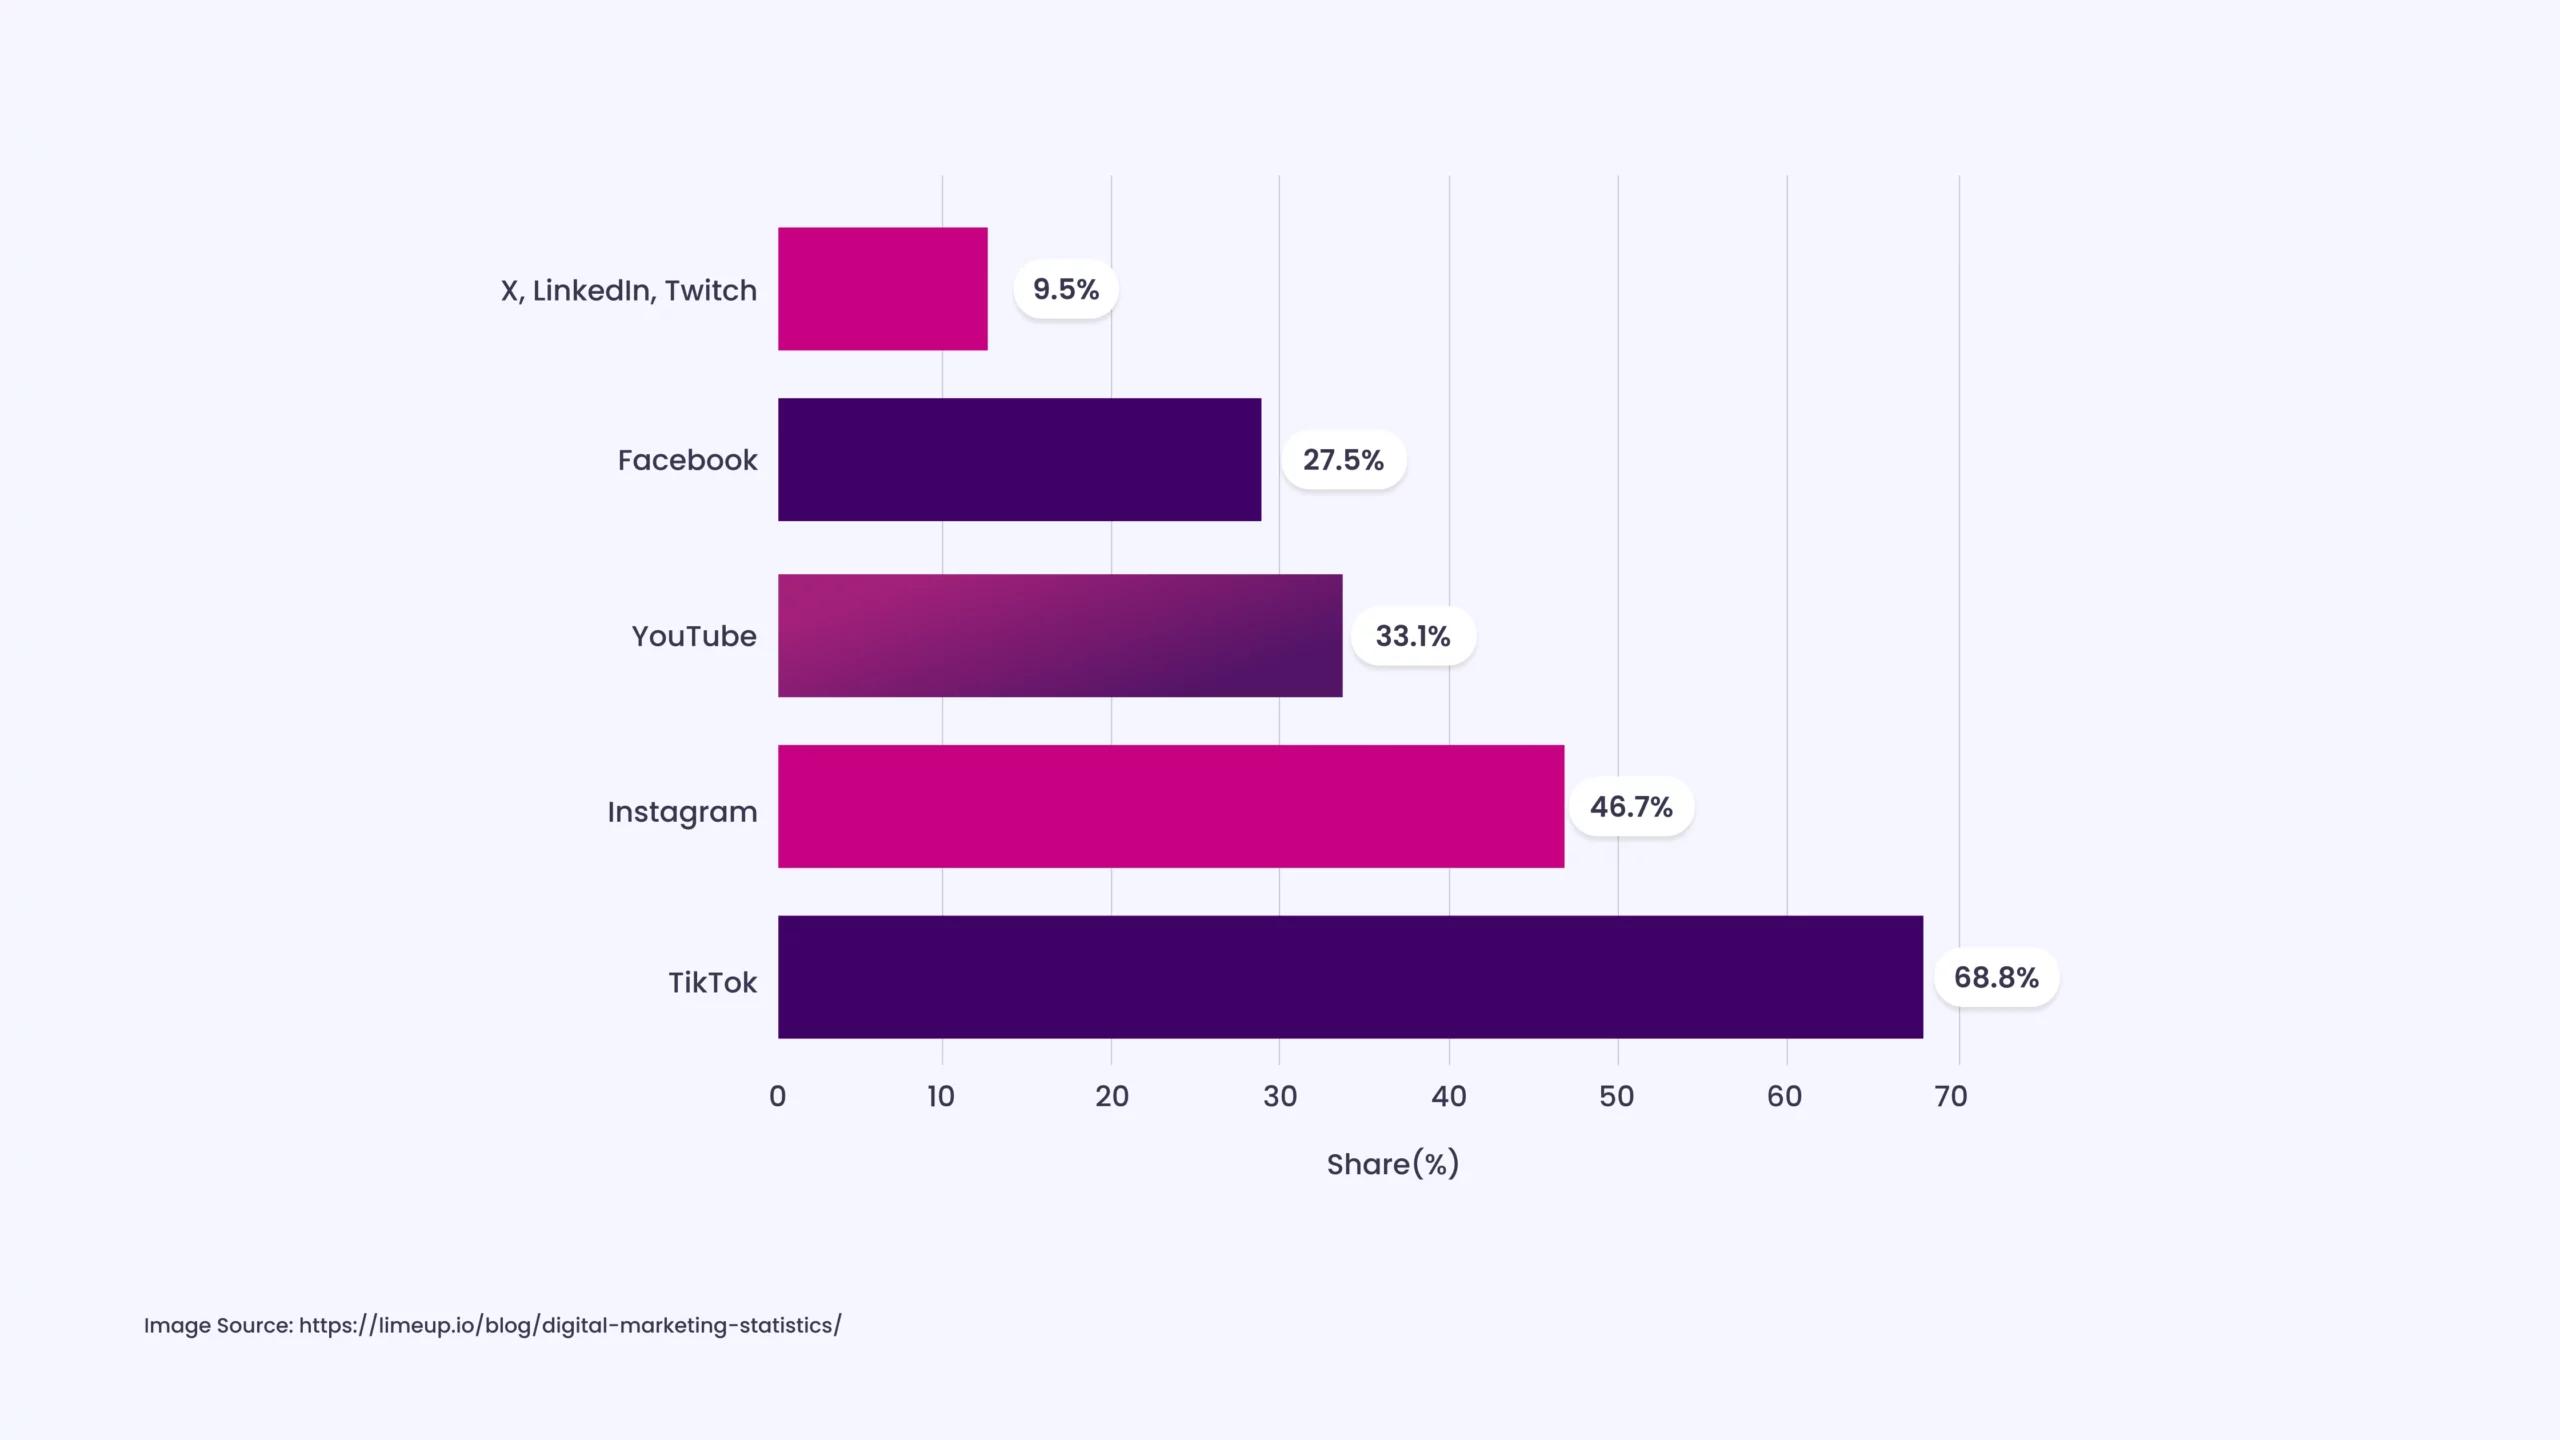
Image Source: https://limeup.io/blog/digital-marketing-statistics/
Marketers concentrate their efforts on up to five key platforms, including TikTok (68.8%), Instagram (46.7%), YouTube (33.1%), Facebook (27.5%), and niche platforms like X/Twitter, LinkedIn, and Twitch (9-10%) to effectively engage their audience with platform-specific content.
Source: https://limeup.io/blog/digital-marketing-statistics/
41. Facebook Still Leads With About 3.1 Billion Monthly Active Users
Despite shifting trends, Facebook remains the largest social platform, with over 3.1 billion monthly active users, and maintains its broad global footprint.
Source: https://newmedia.com/blog/social-media-marketing-statistics
42. YouTube Reaches Nearly 2.9 Billion Users Monthly
YouTube is among the top social platforms by reach, with nearly 2.9 billion monthly active users, many of whom engage with both long‑form and short‑form video content.
Source: https://newmedia.com/blog/social-media-marketing-statistics
43. 69% of Consumers Trust Influencer Recommendations
Consumer trust in influencers remains strong, with 69% of people saying they trust influencer recommendations, often more than they do traditional ads. Source: https://awisee.com/blog/influencer-marketing-statistics/
44. Social Media Ad Spend Is Projected to Exceed $219 Billion in 2026
Social ad investment continues to rise, with global spend expected to surpass $219 billion in 2026, roughly one‑third of total digital ad expenditure.
Source: https://newmedia.com/blog/social-media-marketing-statistics
45. Facebook & Instagram Capture Over 55% of Social Ad Revenue
Combined, Facebook and Instagram account for more than 55% of global social media ad revenue, reflecting their continued dominance in monetized social traffic.
Source: https://newmedia.com/blog/social-media-marketing-statistics
46. TikTok Ad Revenue Expected to Hit Over $20 Billion in 2026
TikTok’s ad business is growing rapidly, with revenue projected to exceed $20 billion, driven by strong engagement and creative ad formats.
Source: https://newmedia.com/blog/social-media-marketing-statistics
47. LinkedIn Ads Have the Highest Average Cost Per Click (~$5.26)
LinkedIn’s ad environment commands higher costs, averaging about $5.26 per click, but also delivers strong performance for B2B and professional audiences.
Source: https://newmedia.com/blog/social-media-marketing-statistics
48. TikTok Users Spend ~55 Minutes Per Day on the App
The average TikTok user spends roughly 55 minutes daily on the platform, demonstrating deep engagement with short‑form social video content.
Source: https://newmedia.com/blog/social-media-marketing-statistics
49. Users Access an Average of 6-7 Social Platforms Per Month
Most social media users now engage with 6-7 different platforms monthly, reflecting a highly multi‑platform environment for content and audience reach.
Source: https://planable.io/blog/social-media-statistics/
50. Engagement Rates Vary Widely by Platform in 2026
Across social networks, engagement rates differ significantly, part of why performance benchmarks must be tailored by platform and audience.
Source: https://blog.hootsuite.com/social-media-statistics/
51. Global Influencer Marketing Spend Is Expected to Be Tens of Billions in 2025-26
Influencer marketing remains big business, with multiple industry analysts estimating global spend in the tens of billions of dollars as brands continue allocating budget to creator partnerships.
Source: https://www.demandsage.com/influencer-marketing-stats/
52. Over 86% of Marketers Use Influencer Marketing in 2025
A strong majority, over 86%, of marketers reported using influencer marketing in 2025, showing how widespread creator collaborations have become.
Source: https://www.goviralglobal.com/post/influencer-marketing-facts-and-statistics-updated-september-2025
53. 73.2% of Brands Work With at Least 10 Influencers Per Campaign
Nearly three‑quarters of brands collaborate with at least 10 influencers on campaigns, indicating the scale and frequency of multi‑creator strategies in modern marketing.
Source: https://www.goviralglobal.com/post/influencer-marketing-facts-and-statistics-updated-september-2025
54. Over 72% of Consumers Use Social Media as Their Main Source for Brand Discovery
More than 72% of consumers report turning to social media first when looking for new brands or products, making social platforms essential for awareness strategies.
Source: https://newmedia.com/blog/social-media-marketing-statistics
55. Micro‑Influencers Are Used 10x More Than Mega Influencers
Brands now prefer working with micro‑influencers (smaller followings with tighter engagement), using them about 10 times more often than mega‑influencers in campaigns.
Source: https://www.demandsage.com/influencer-marketing-stats/
56. TikTok Influencers Drive 45% of Youth Purchasing Decisions
In TikTok’s active youth demographic, approximately 45% of Gen Z consumers say they’ve purchased items based on influencer guidance, showing strong creator impact on buying behavior.
Source: https://awisee.com/blog/influencer-marketing-statistics/
57. Nano Influencers (>1K Followers) Represent the Largest Creator Segment
Nano influencers (1,000-10,000 followers) make up the biggest share of creators globally, highlighting that most influence on social platforms comes from smaller but tight‑knit communities.
Source: https://theinfluencermarketingfactory.com/2026-influencer-marketing-predictions/
58. Creator Economy Projected to Reach ~127M Active Creators
Estimates indicate around 127 million active global creators in the creator economy, charting rapid expansion and creating opportunities for brand collaborations.
Source: https://theinfluencermarketingfactory.com/2026-influencer-marketing-predictions/
59. 80.8% of Marketers Use Instagram for Influencer Campaigns
Instagram remains the most popular influencer marketing platform, with 80.8% of marketers deploying campaigns there, more than any other social channel.
Source: https://www.demandsage.com/influencer-marketing-stats/
60. Facebook Is the Second Most Used Influencer Platform (60.5%)
Following Instagram, 60.5% of marketers leverage Facebook for influencer marketing, especially for brands focusing on broad reach and demographic diversity.
Source: https://www.demandsage.com/influencer-marketing-stats/
61. LinkedIn Only 25.9% Used for Influencer Marketing
LinkedIn trails other social platforms in influencer marketing usage, with about 25.9% of marketers incorporating LinkedIn creators into strategies, often for B2B reach.
Source: https://www.demandsage.com/influencer-marketing-stats/
62. Shoppable Posts Increase Click‑Throughs by ~32%
Interactive, shoppable formats on social media, especially on Instagram and TikTok, deliver about 32% more click‑throughs than standard ad formats, improving commerce performance.
Source: https://newmedia.com/blog/social-media-marketing-statistics
63. Live Streaming Is Used Monthly by Over 37% of Users
Live video formats continue to gain traction, with more than 37% of social media users engaging with live content monthly, key for real‑time interaction. Source: https://newmedia.com/blog/social-media-marketing-statistics
64. User‑Generated Content Influences ~79% of Purchases
UGC remains a powerful driver of purchase decisions, with around 79% of consumers influenced by peer‑generated content over branded messaging.
Source: https://newmedia.com/blog/social-media-marketing-statistics
65. Instagram Carousel Posts Generate ~35% More Engagement
Carousel posts on Instagram deliver about 35% higher engagement than single‑image posts, showing the advantage of multi‑card storytelling formats.
Source: https://newmedia.com/blog/social-media-marketing-statistics
66. Pinterest Product Pins Drive ~20% More Interaction
Product‑tagged pins on Pinterest engage users by about 20% more than standard pins, highlighting the impact of commerce‑oriented social features.
Source: https://blog.hootsuite.com/social-media-statistics/
67. Reddit Niche Communities See ~3x Higher Engagement
Reddit posts in highly focused communities generate about three times more engagement than broad‑topic posts, underlining the value of niche targeting.
Source: https://blog.hootsuite.com/social-media-statistics
68. Snapchat Users Open the App ~40+ Times Daily
Snapchat remains one of the most frequently accessed apps, with users opening the platform over 40 times per day on average, a sign of habitual use.
Source: https://blog.hootsuite.com/social-media-statistics
69. Brands Responding to Comments Within 24 Hours See ~47% Higher Engagement on Future Posts
Timely interaction pays off: brands that reply quickly to comments often see engagement rise by nearly 47% on subsequent posts. Source: https://blog.hootsuite.com/social-media-statistics/
70. Social Media Has Become the Primary Acquisition Channel for 83% of Marketers
A strong majority, 83% of marketers, now view social media as their leading channel for acquiring new customers, showing how essential these platforms are in modern marketing approaches.
Source: https://sqmagazine.co.uk/social-media-marketing-statistics/
Marketing Automation & AI Statistics for 2026
71. 75% of Businesses Plan to Increase Automation Investment in 2026
Three-quarters of marketing leaders plan to boost spend on marketing automation tools and processes in 2026, underscoring automation’s continued strategic priority.
Source: https://www.thunderbit.com/blog/marketing-automation-stats-insights-roi
72. AI Market Growth Projections (2025-2030)
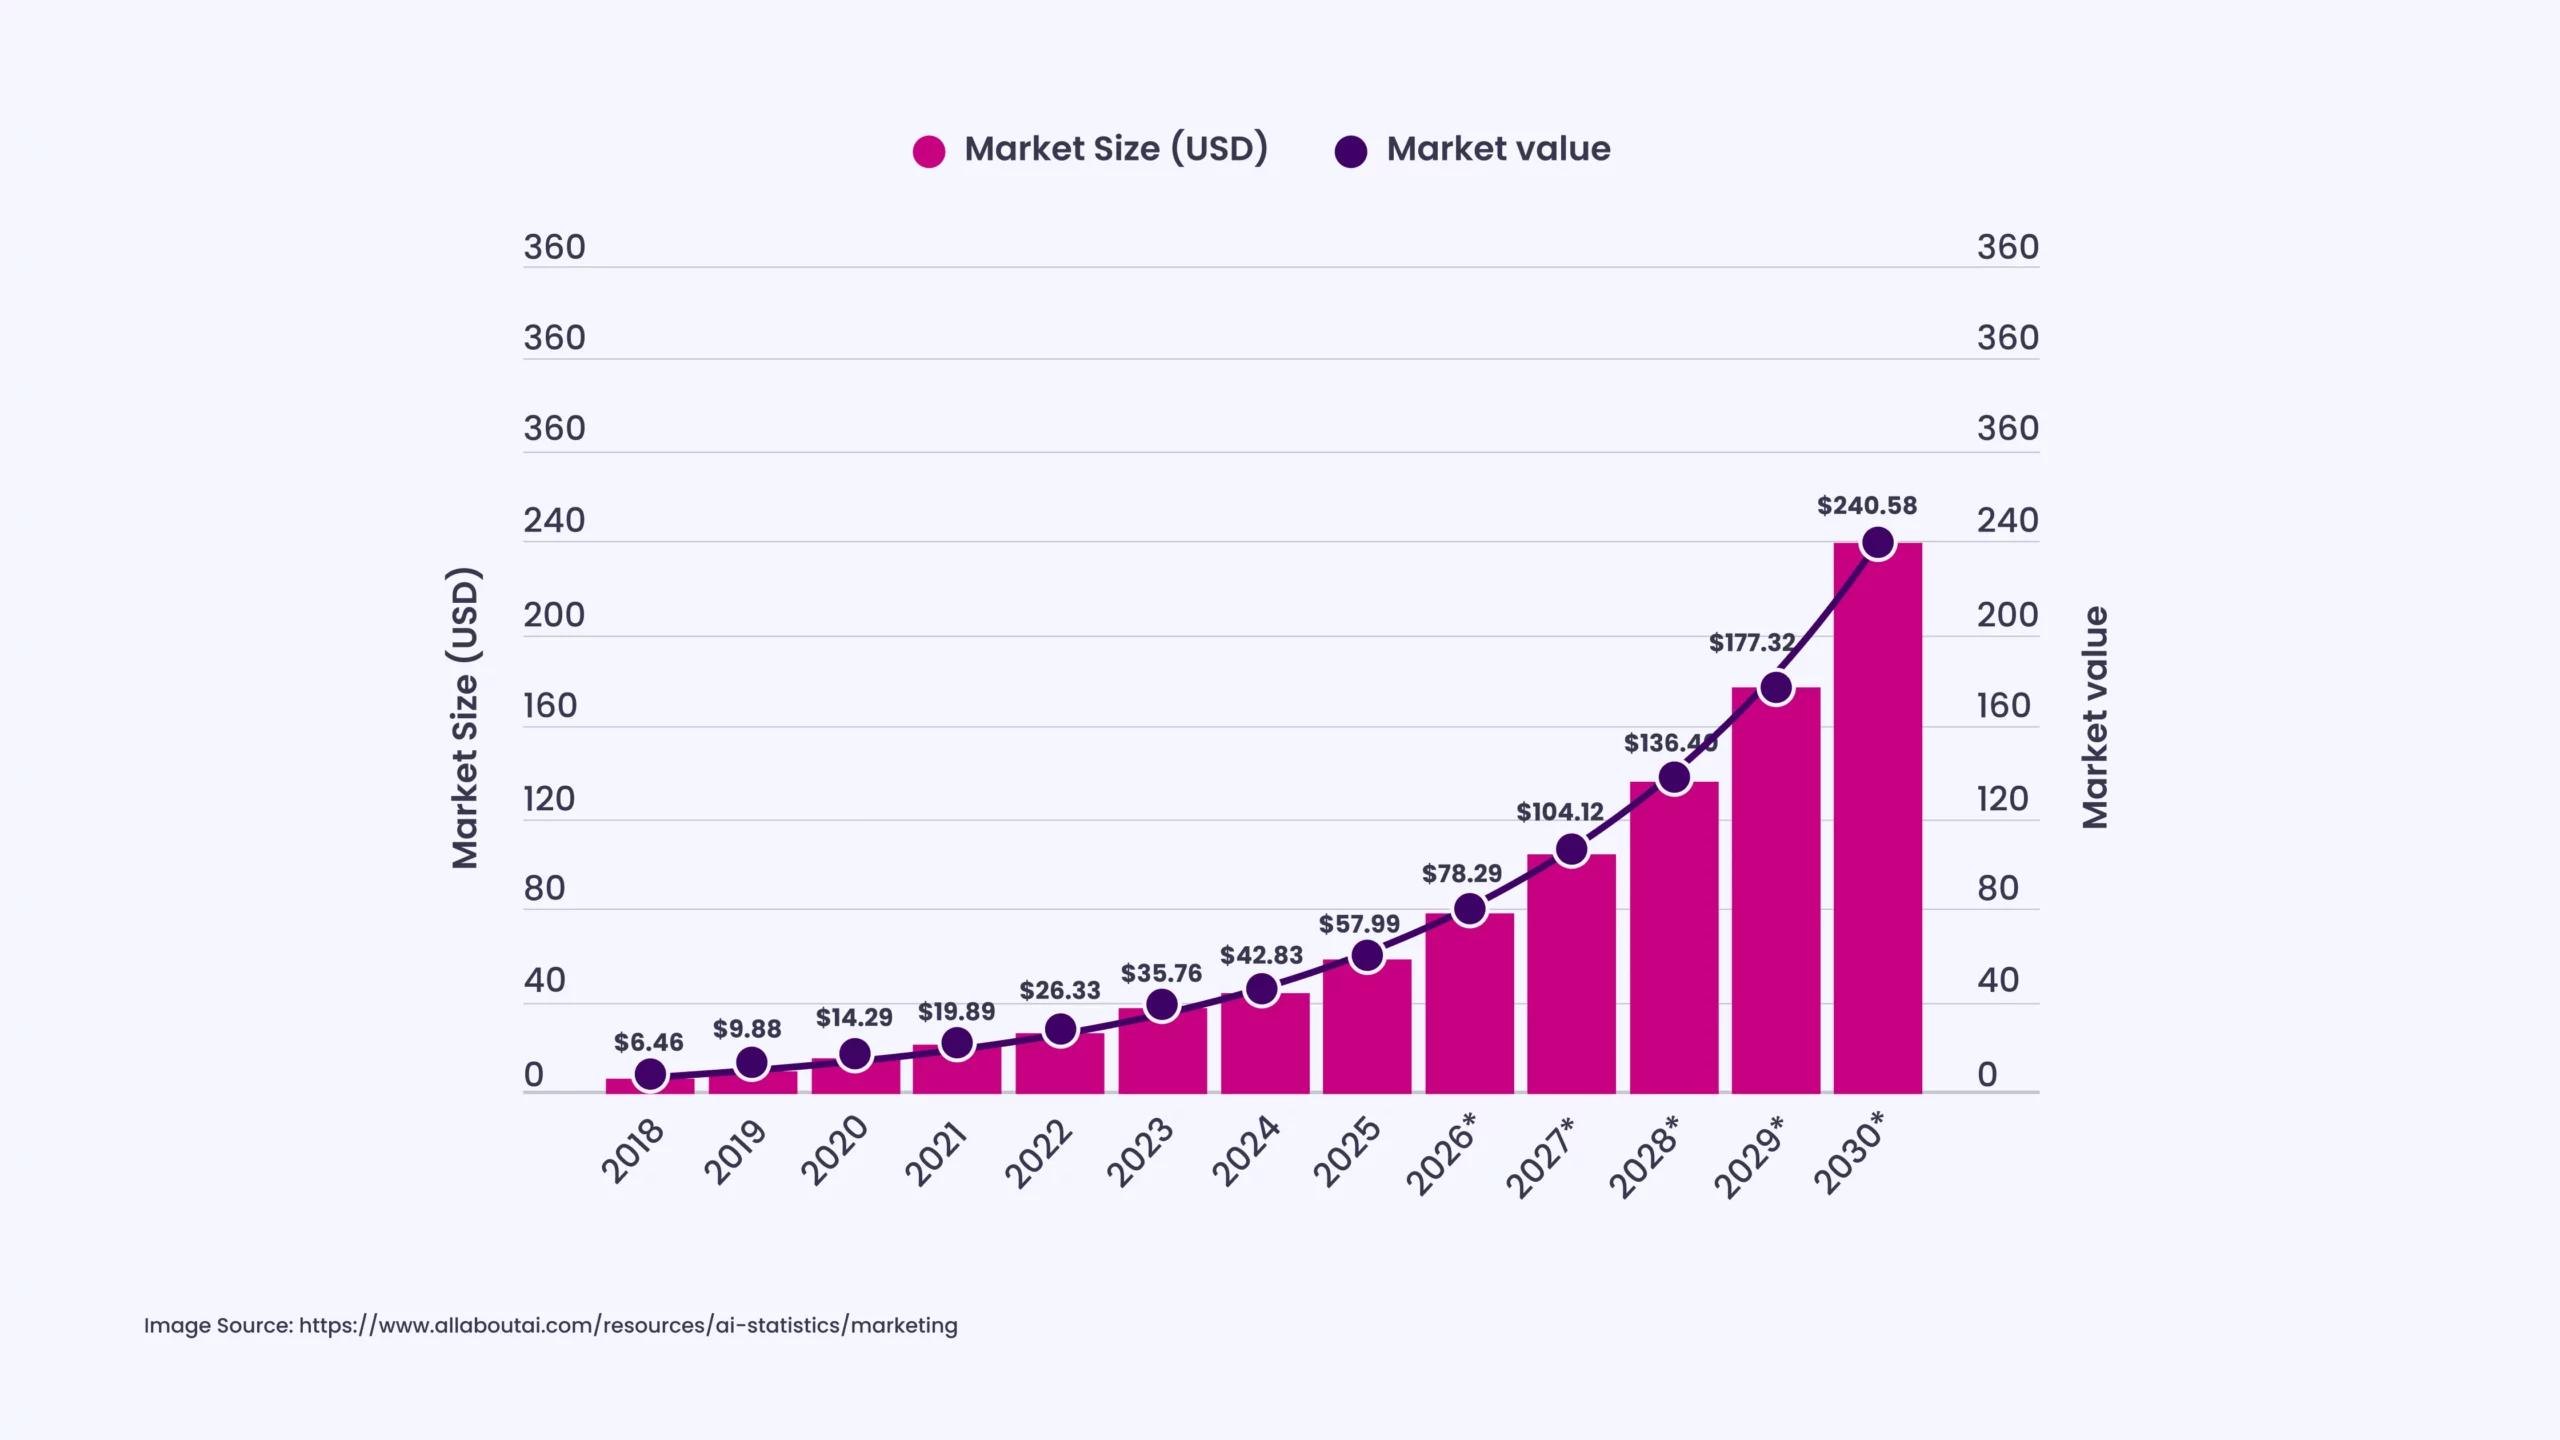
Image Source: https://www.allaboutai.com/resources/ai-statistics/marketing
The AI marketing industry is projected to experience significant growth, with an annual compound growth rate (CAGR) of 32.9% from 2025 to 2030.
Source: https://www.allaboutai.com/resources/ai-statistics/marketing
73. Triggered Automated Emails Generate 320% More Revenue Than Standard Emails
Automated emails triggered by user actions (such as cart abandonment or welcome flows) can generate 320% more revenue than generic email campaigns.
Source: https://www.seo.com/ai/marketing-statistics
74. 77% of Marketers Use AI‑Powered Automation for Personalization
More than three‑quarters of marketers now incorporate AI into automation workflows to tailor content and campaign messages to individual user behavior.
Source: https://www.sqmagazine.co.uk/ai-in-marketing-statistics
75. Only 9% of Organizations Have Fully Automated Customer Journeys
Despite widespread adoption of automation tools, only a small percentage of companies have achieved full end‑to‑end automation of the customer journey, highlighting opportunities for improvement.
Source: https://www.allaboutai.com/resources/ai-statistics/marketing
76. 91% of Organizations Report Increasing Demand for Automation Across Departments
Nearly all organizations surveyed say automation demand is rising not just in marketing, but across customer support, sales, and service teams as well.
Source: https://www.allaboutai.com/resources/ai-statistics/marketing
77. Global AI Marketing Industry Projects $47.32B in Market Value in 2026
The global market for AI marketing technologies, including tools for predictive analytics, automation, and personalization, is projected to be worth $47.32 billion in 2026.
Source: https://www.allaboutai.com/resources/ai-statistics/marketing
78. 88% of Marketers Use AI Tools in Their Daily Work
A vast majority of marketers now use AI daily to support tasks such as content creation, analytics, personalization, and automated decision‑making.
Source: https://www.sqmagazine.co.uk/ai-in-marketing-statistics
79. 92% of Businesses Plan to Invest in Generative AI Tools Soon
Almost all businesses surveyed intend to increase investment in generative AI technologies soon to support content, personalization, and automation workflows.
Source: https://www.seo.com/ai/marketing-statistics
80. 58% of Marketers Integrate Generative AI Into Their Daily Workflow
More than half of marketers report integrating generative AI directly into their day‑to‑day work, particularly to scale content production and automate internal processes.
Source: https://www.seo.com/ai/marketing-statistics
81. AI Marketing Tools Can Improve Customer Retention by 30%
Marketing teams leveraging AI-driven analytics and personalized campaigns can see 30% higher customer retention by delivering tailored experiences based on customer behavior.
Source: https://www.thunderbit.com/blog/marketing-automation-stats-insights-roi
82. AI‑Driven Campaign Optimization Improves Targeting Accuracy by 47%
Campaigns that use AI‑based automation and smart algorithms see an average 47% improvement in targeting accuracy, helping marketers reduce wasted spend.
Source: https://www.allaboutai.com/resources/ai-statistics/marketing
83. 71% of Brands Say AI Enables Real‑Time Personalization
A majority of brands leverage AI to personalize content and experiences in real‑time, enhancing the customer journey and increasing engagement.
Source: https://www.sqmagazine.co.uk/ai-in-marketing-statistics
84. AI‑Led Segmentation Yields ~32% Higher Conversion Rates
Using AI to segment audiences and deliver tailored experiences can boost conversion rates by around 32%, making automated segmentation a high‑impact practice.
Source: https://www.seo.com/ai/marketing-statistics
85. 93% of Marketers Say AI Boosts Content Production Speed
AI helps marketers create content faster, with 93% reporting that it speeds up content creation, allowing teams to focus on more strategic tasks.
Source: https://www.thunderbit.com/blog/marketing-automation-stats-insights-roi
Email Marketing Statistics for 2026
86. Average Email Open Rate Across Industries in 2026 Is ~43.46%
In 2026, the typical email open rate, the percentage of recipients who open a marketing email, sits around 43.46%, reflecting strong engagement despite privacy‑related tracking changes.
Source: https://growth-onomics.com/email-marketing-benchmarks-2026-open-rates-ctrs/
87. Average Click‑Through Rate (CTR) for Email Marketing Is ~2.09%
Across email campaigns in 2026, the average CTR (click-through rate), the percentage of recipients who click a link, is approximately 2.09%, a core indicator of meaningful engagement beyond opens.
Source: https://growth-onomics.com/email-marketing-benchmarks-2026-open-rates-ctrs/
88. Click‑To‑Open Rate (CTOR) Averages Around 6.81%
The click‑to‑open rate, the percentage of those who opened and then clicked, is about 6.81%, showing how effectively content within emails drives action once opened.
Source: https://growth-onomics.com/email-marketing-benchmarks-2026-open-rates-ctrs/
89. Over 4.6 Billion People Use Email Worldwide
More than 4.6 billion people actively use email, over half of the global population, underlining how universal this channel remains for reaching audiences.
Source: https://www.demandsage.com/email-marketing-statistics/
90. Email Marketing ROI Often Delivers $36-$42 for Every $1 Spent
Email continues to outperform many digital channels: for every $1 spent, businesses typically earn an ROI of $36 to $42, one of the highest returns in marketing.
Source: https://www.demandsage.com/email-marketing-statistics/
91. Nearly 99% of Email Users Check Their Inboxes Daily
Almost all email users (around 99%) check their inbox at least once per day, making email one of the most consistent ways to reach engaged audiences.
Source: https://www.webtoffee.com/blog/email-marketing-statistics/
92. In 2026, Nearly 392 Billion Emails Are Sent Daily
By 2026, daily global email traffic is projected to reach about 392 billion messages, underscoring the massive scale of email communication and marketing.
Source: https://www.webtoffee.com/blog/email-marketing-statistics/
93. Email Deliverability Rates Often Exceed 99%
Deliverability, the percentage of emails that actually reach the inbox rather than spam or bounce, commonly exceeds 99%, indicating strong technical hygiene and sender reputation in modern campaigns.
Source: https://www.webtoffee.com/blog/email-marketing-statistics/
E‑commerce & Geomarketing Statistics for 2026
94. Global Retail E‑commerce Sales Projected to Reach $6.88 Trillion in 2026
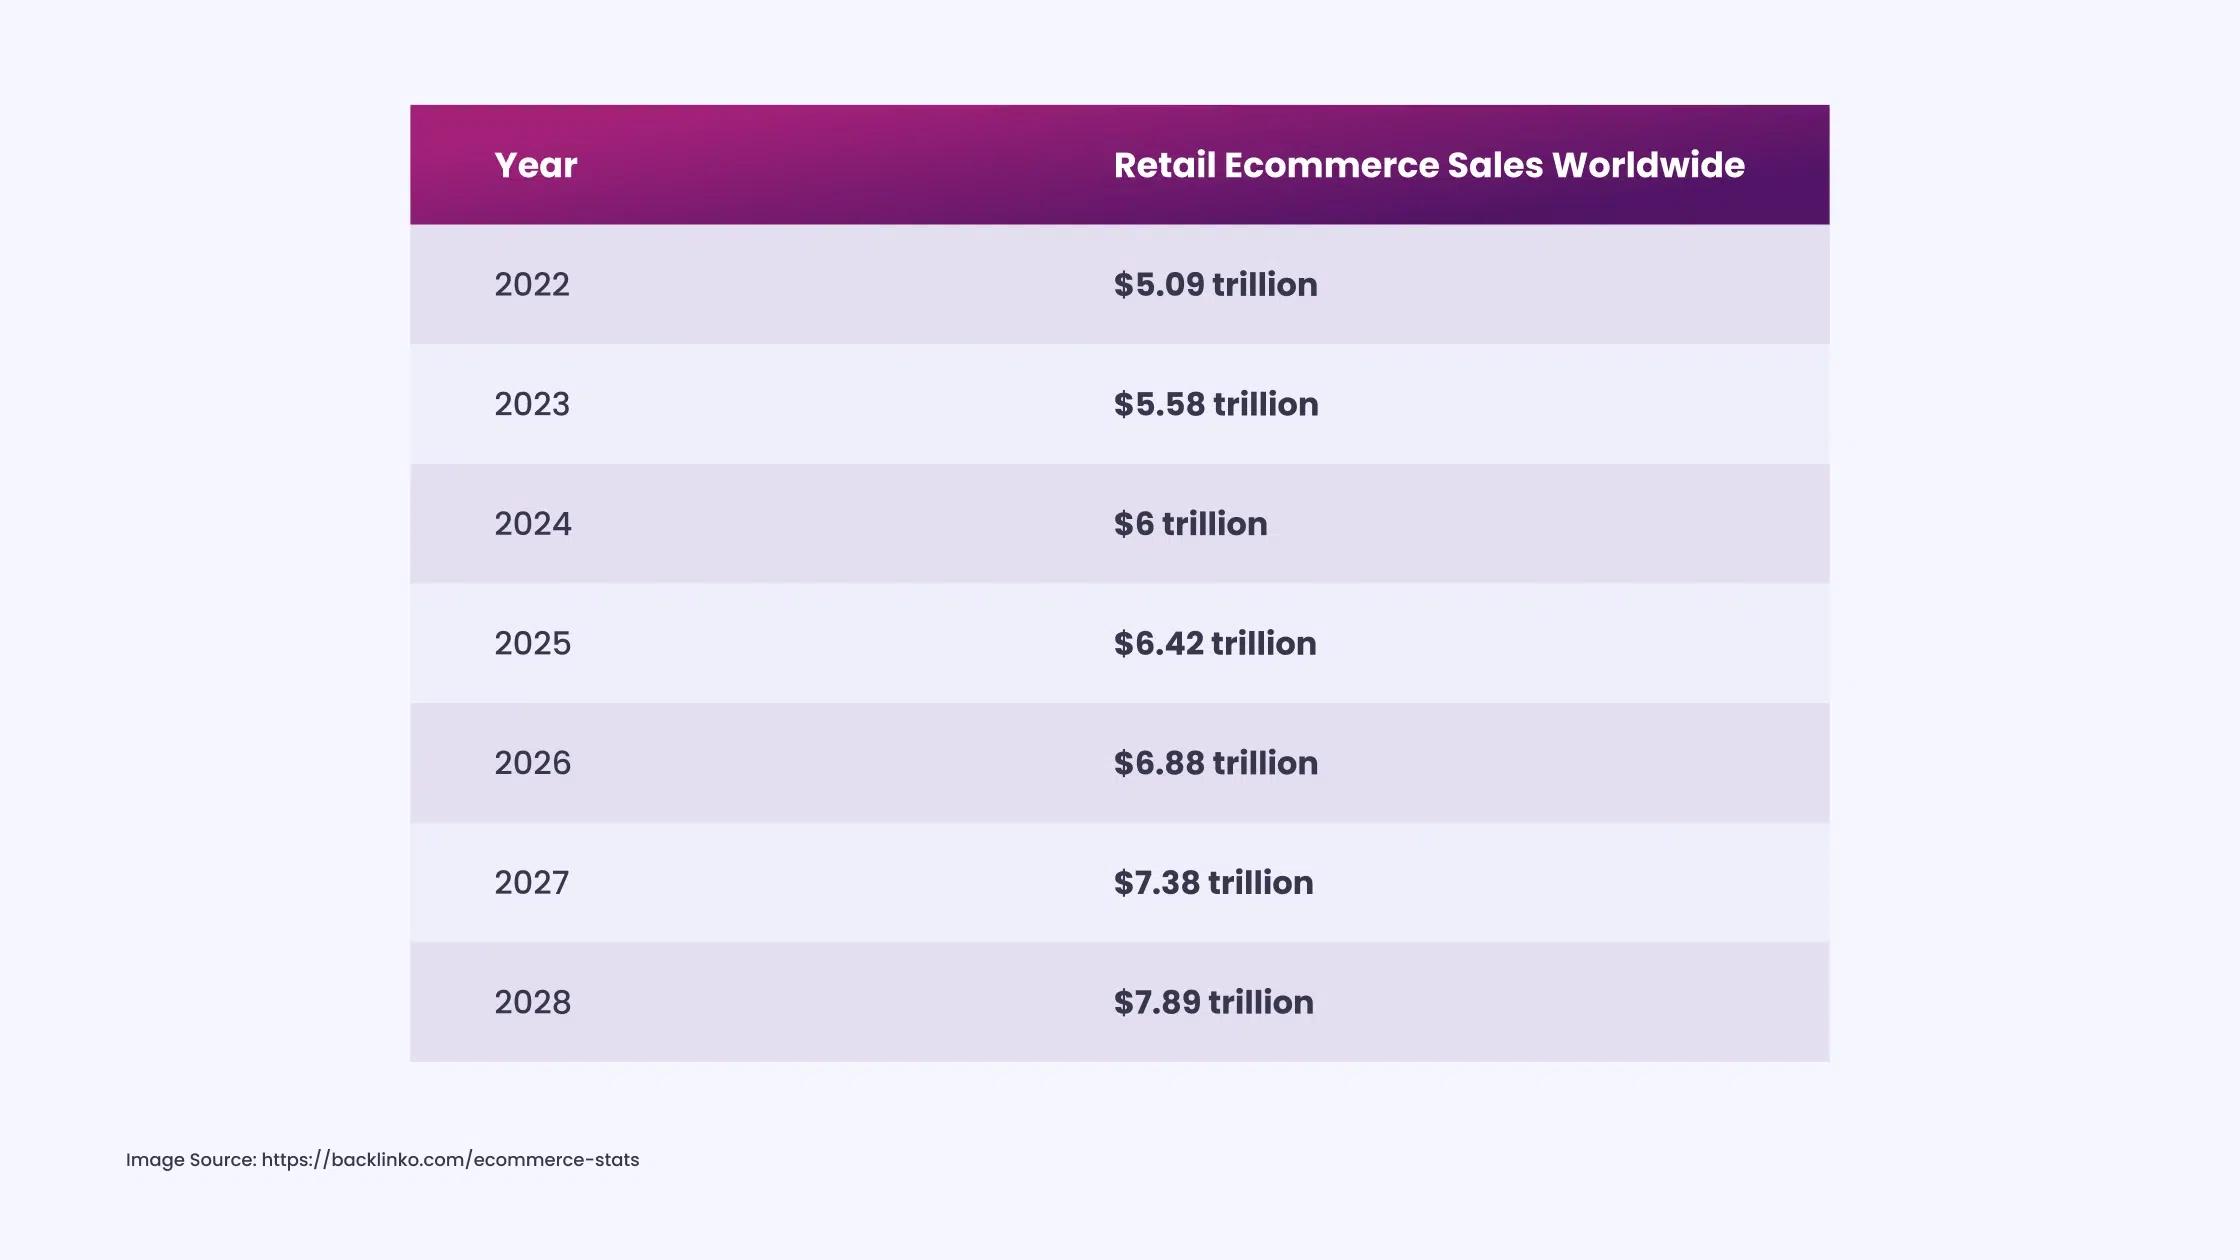
Image Source: https://backlinko.com/ecommerce-stats
Worldwide retail ecommerce sales are forecasted to total about $6.88 trillion in 2026, continuing steady annual growth and solidifying ecommerce as a dominant channel in global retail.
Source: https://backlinko.com/ecommerce-stats
95. Ecommerce Will Account for Around 21.1% of Global Retail Sales in 2026
Ecommerce’s share of total global retail sales is expected to climb to approximately 21.1% in 2026, reinforcing its critical role in consumer buying behavior across markets.
Source: https://backlinko.com/ecommerce-stats
96. Over 3 Billion People Will Buy Online in 2026
More than three billion people are projected to make at least one online purchase in 2026, nearly half of the world’s internet users, highlighting the scale and penetration of ecommerce.
Source: https://www.flowlu.com/blog/productivity/ecommerce-statistics/
97. Mobile Devices Will Drive Nearly 60% of Ecommerce Sales
Mobile commerce continues to dominate, with about 59-60% of all ecommerce transactions projected to be completed on smartphones and other mobile devices in 2026.
Source: https://www.flowlu.com/blog/productivity/ecommerce-statistics/
98. 80% of US Consumers Perform Local Searches Weekly
A significant portion of U.S. consumers, around 80%, conduct local searches (e.g., “near me” or city + product queries) on search engines at least once each week, making local visibility a key driver of in‑market foot traffic and online interactions.
Source: https://wiserreview.com/blog/local-seo-statistics/
99. 98% of Customers Search Online for Nearby Businesses Before Visiting
Nearly all consumers now search online to find nearby businesses before visiting in person, a statistic that underscores the necessity of optimized local listings and a mobile presence for physical‑store performance.
Source: https://wiserreview.com/blog/local-seo-statistics/
100. 46% of all Google Searches Include Local Intent
Almost half of all Google searches have local intent, meaning users seek information tied to a specific location, whether to find a store, check hours, or compare nearby services.
Source: https://www.safaridigital.com.au/blog/local-seo-statistics/
101. About 28% of Local Searches Result in a Purchase Within 24 Hours
Consumers searching with local intent tend to be highly purchase-ready: roughly 28% of local searches result in a purchase within a day, underscoring the critical role of local visibility in conversion.
Source: https://localiq.com/blog/local-seo-statistics/
102. 78% of Local Mobile Searches Lead to an Offline Purchase
More than three‑quarters of local mobile searches translate into offline purchases, demonstrating the powerful connection between mobile intent and real‑world buying behavior.
Source: https://www.safaridigital.com.au/blog/local-seo-statistics/
103. Local SEO Campaigns Can Return ~500% ROI for 40% of Businesses
Close to 40% of businesses report that their local SEO efforts deliver returns around 500% or more, showing how local optimization can significantly amplify marketing ROI.
Source: https://localiq.com/blog/local-seo-statistics/
104. Nearly 25% of Website Traffic Comes From Local Search
For many sites with local relevance, about one‑quarter of total traffic comes from local searchers, underscoring the value of localized optimization for online visibility and engagement.
Source: https://localiq.com/blog/local-seo-statistics/
105. 49% of Local Businesses Get Over 1,000 Views on Their Business Listings Monthly
Nearly half of local businesses see more than 1,000 monthly views on their Google Business Profile listings, which can translate into higher visibility and customer actions.
Source: https://99firms.com/research/local-seo-statistics/
106. 56% of Customers Expect Accurate Business Info Online
Over half of customers expect complete and accurate business details (such as hours, address, and contact information) online, a factor that strongly influences local search performance and consumer trust.
Source: https://99firms.com/research/local-seo-statistics/
107. Yelp & Facebook Are Used by ~48% of Local Searchers (vs. 15% for Apple Maps)
When discovering businesses locally, about 48% of users rely on Yelp and Facebook, while Apple Maps captures around 15%, highlighting how directory presence influences local reach. Source: https://wiserreview.com/blog/local-seo-statistics/
Mobile Marketing Statistics for 2026
108. 90-98% of SMS Messages Are Opened by Recipients
SMS continues to outperform most marketing channels in visibility; 90-98% of business text messages are opened, often within minutes of receipt. This makes SMS one of the most direct and effective ways to reach customers on mobile.
Source: https://www.omnisend.com/blog/sms-marketing-statistics
109. On Average, 90% of SMS Messages Are Read Within 3 Minutes
Nearly all SMS marketing messages are read almost immediately after delivery, with around 90% read within 3 minutes, which dramatically increases the likelihood of timely engagement.
Source: https://www.omnisend.com/blog/sms-marketing-statistics
110. 57% of Users’ Daily Online Time Is Spent on Mobile Devices
More than half of daily online activity now occurs on mobile devices, highlighting how central mobile has become for consumer engagement, browsing, and interaction with digital content.
Source: https://sqmagazine.co.uk/mobile-advertising-statistics
111. $402 Billion in Global Mobile Ad Spending Was Estimated in 2024
Global mobile advertising spend reached approximately $402 billion in 2024, and this number continues to grow as marketers prioritize mobile‑first ad placements, including in‑app ads and mobile display.
Source: https://sqmagazine.co.uk/mobile-advertising-statistics
112. Over 75% of Retail Website Visits Come From Smartphones
Mobile devices now account for more than 75% of all retail website visits, underscoring the importance of mobile optimization and mobile marketing strategies for capturing traffic and driving conversions.
Source: https://sqmagazine.co.uk/mobile-advertising-statistics
Content Marketing Statistics for 2026
113. 82% of Marketers Actively Invest in Content Marketing
A strong majority of marketers (about 82%) report actively investing in content marketing, underscoring its widespread adoption and importance in digital strategies for 2026.
Source: https://99firms.com/research/content-marketing-statistics/
114. Content Marketing Costs Up to 62% Less Than Traditional Marketing
Compared with traditional marketing channels, content marketing can cost up to 62% less while still driving significant engagement and long‑term ROI.
Source: https://99firms.com/research/content-marketing-statistics/
115. 92% of Content Marketers Produce Blog Content
Blogs remain the foundation of content strategies for most marketers, with 92% of them producing blog posts as a core tactic to attract and inform audiences.
Source: https://99firms.com/research/content-marketing-statistics/
116. 79% of Companies Aim to Generate More Quality Leads With Content Marketing
Nearly four in five companies say one of their primary goals with content marketing is to generate higher‑quality leads, signaling content’s role in pipeline building.
Source: https://99firms.com/research/content-marketing-statistics/
117. Video Content Is Used by More Than 90% of Content Marketers
More than 90% of content marketers now incorporate video into their strategies, reflecting video’s dominance in audience engagement and message retention.
Source: https://www.demandsage.com/content-marketing-statistics/
118. 83% of Content Marketers Say Video Increased Website Traffic
A large majority, 83%, report that video content has helped increase traffic to their websites, showing how visual storytelling directly drives measurable engagement.
Source: https://www.demandsage.com/content-marketing-statistics/
119. 79% of Marketers Create Short‑Form Articles or Posts
Short, concise article formats are widely used, with 79% of marketers producing short‑form written content as part of their content mix to engage audiences quickly online.
Source: https://entrepreneurshq.com/content-marketing-statistics/
120. Global Content Marketing Revenue Expected to Reach ~$107.5B by 2026
The global content marketing industry’s revenue is projected to hit around $107.5 billion by 2026, highlighting its economic scale and growth potential as a major part of digital strategies.
Source: https://entrepreneurshq.com/content-marketing-statistics/
What You Should Keep on Your Digital Marketing Radar
This blog has gathered over 110 essential digital marketing stats, so you don’t have to sift through countless reports. With everything moving fast, from AI and automation to mobile and e-commerce, it’s easy to feel like there’s too much information to manage.
But now, the most relevant insights are right here for you. We know that staying updated on every trend isn’t always realistic for brands.
That’s where INSIDEA comes in. With our expertise, we help you focus on what matters most, making sure your brand stays on the right path towards lasting success.
Get High-Intent Leads With INSIDEA’s Digital Marketing Subscription
Most businesses struggle because execution is split across too many tools, vendors, and timelines. SEO lives in one place, ads in another, content somewhere else, and reporting rarely lines up.
INSIDEA solves that by giving you a dedicated marketing team, working on a monthly subscription, covering every channel that drives demand and pipeline.
Instead of managing agencies, freelancers, and scattered deliverables, you get a single point of ownership for planning, execution, and ongoing optimization across your whole marketing stack.
What you get with INSIDEA’s digital marketing subscription:
- SEO: on-page SEO, technical fixes, link building, online reputation management, Google Business Profile support
- Content Marketing: blogs, articles, case studies, newsletters, ebooks, whitepapers
- Social Media Marketing: LinkedIn, Facebook, Instagram, X (Twitter), TikTok
- Email Marketing: campaigns, newsletters, lifecycle emails, list cleanup, and targeting
- Lead Generation: LinkedIn outbound, email outbound, appointment setting
- Performance Marketing: Google Ads, LinkedIn Ads, Meta Ads, media buying support
- WordPress Management and Development: website updates, design, development, integrations, ongoing maintenance
- CRM and Automation: workflow setup, lead routing, reporting-ready data structure